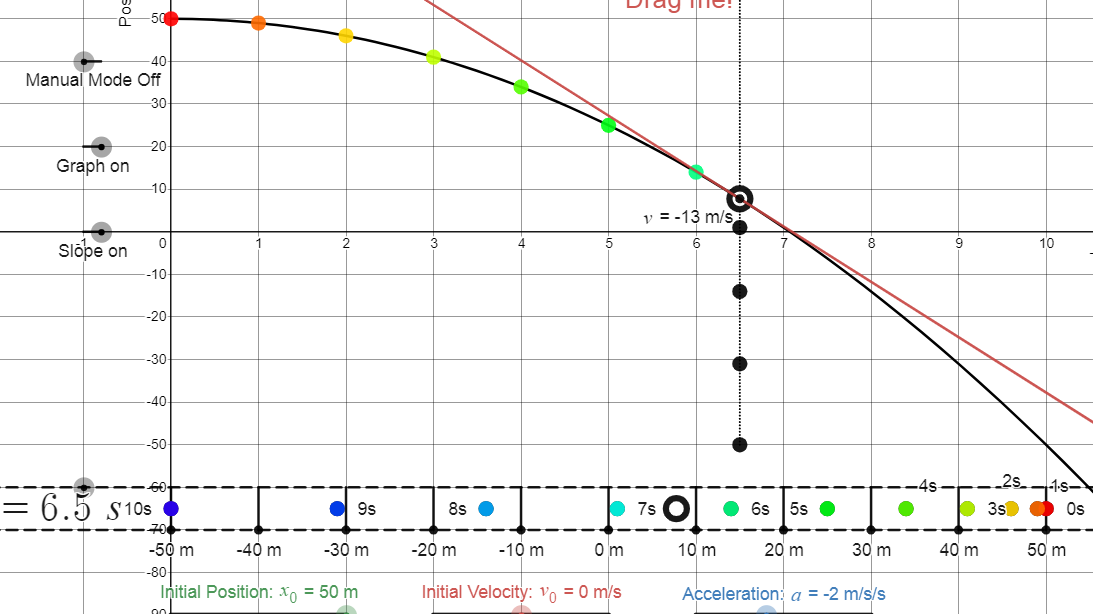
Position-Time Graph
This simulation allows students to explore position vs. time graphs and compare them with equations of position as a function of time as well as a motion map.
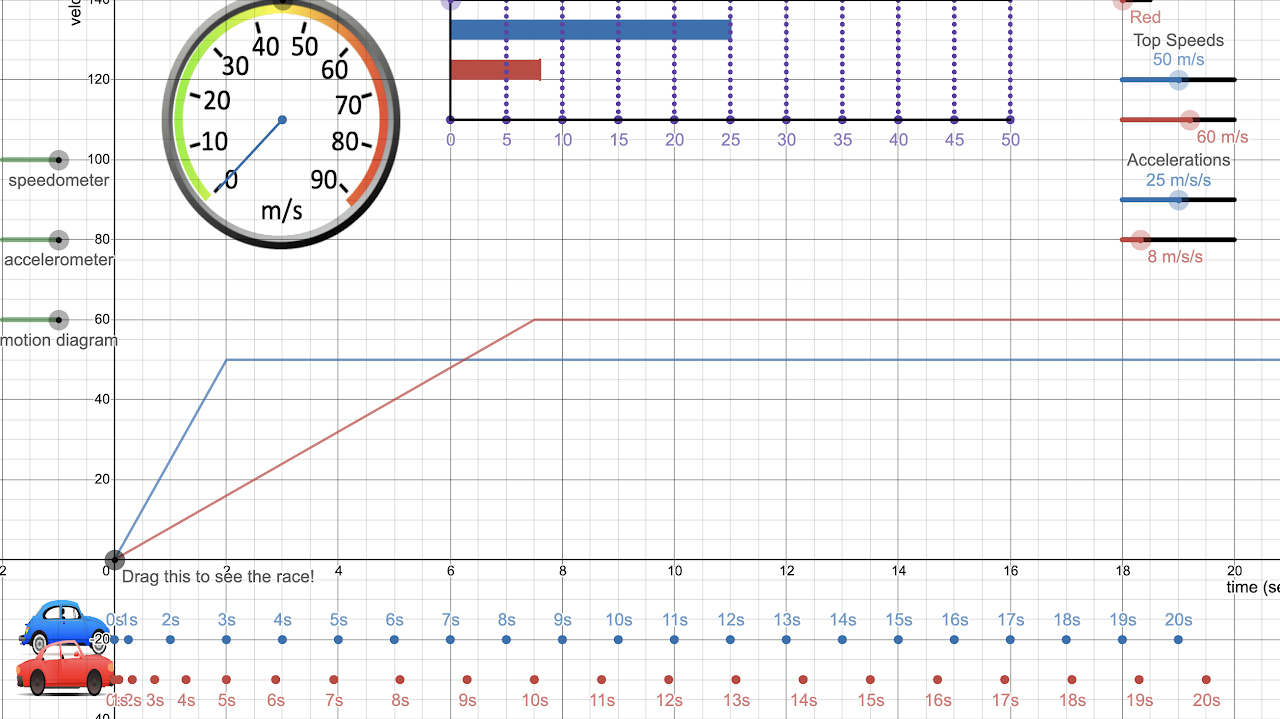
Two Car Race
A velocity graph with optional speedometer, accelerometer, and motion diagram for two cars. Adjust top speeds and initial accelerations. Toggle between constant speed mode for each car.
I like to start with this video: World's Greatest Drag Race, then have the essential question be: Why did the GT-R win with one of the slowest top speeds? Afterwards we look at 0-60 times for these cars here.
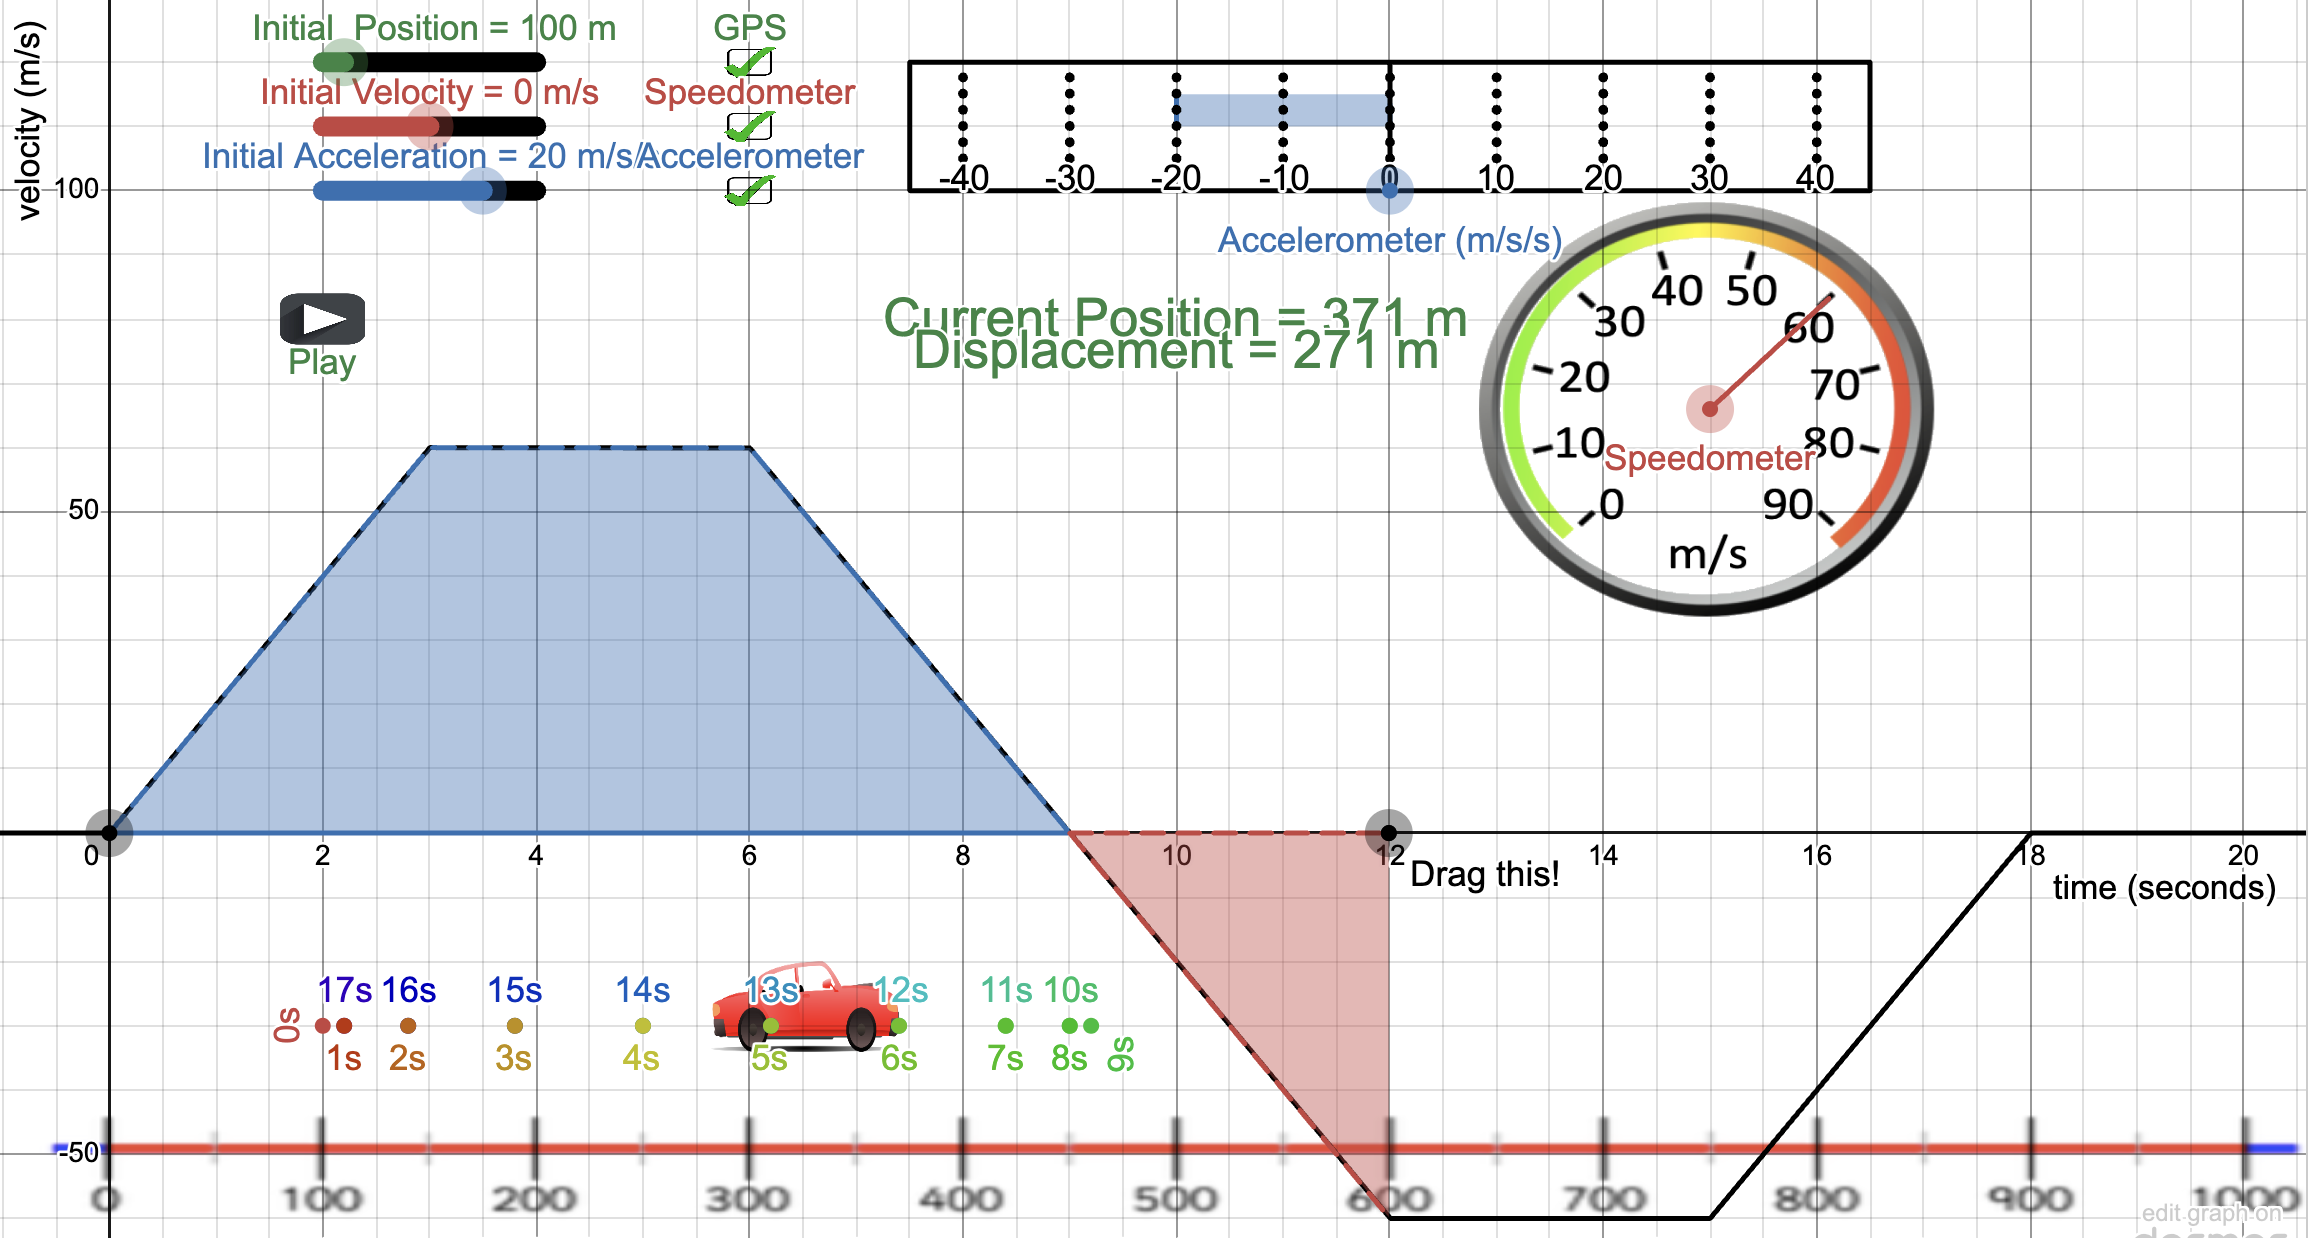
Velocity-Time Graph
Investigate velocity vs. time graph for a car moving back and forth.
Supporting Documents
Digital WorksheetBig Matching Position and Velocity Time Graphs
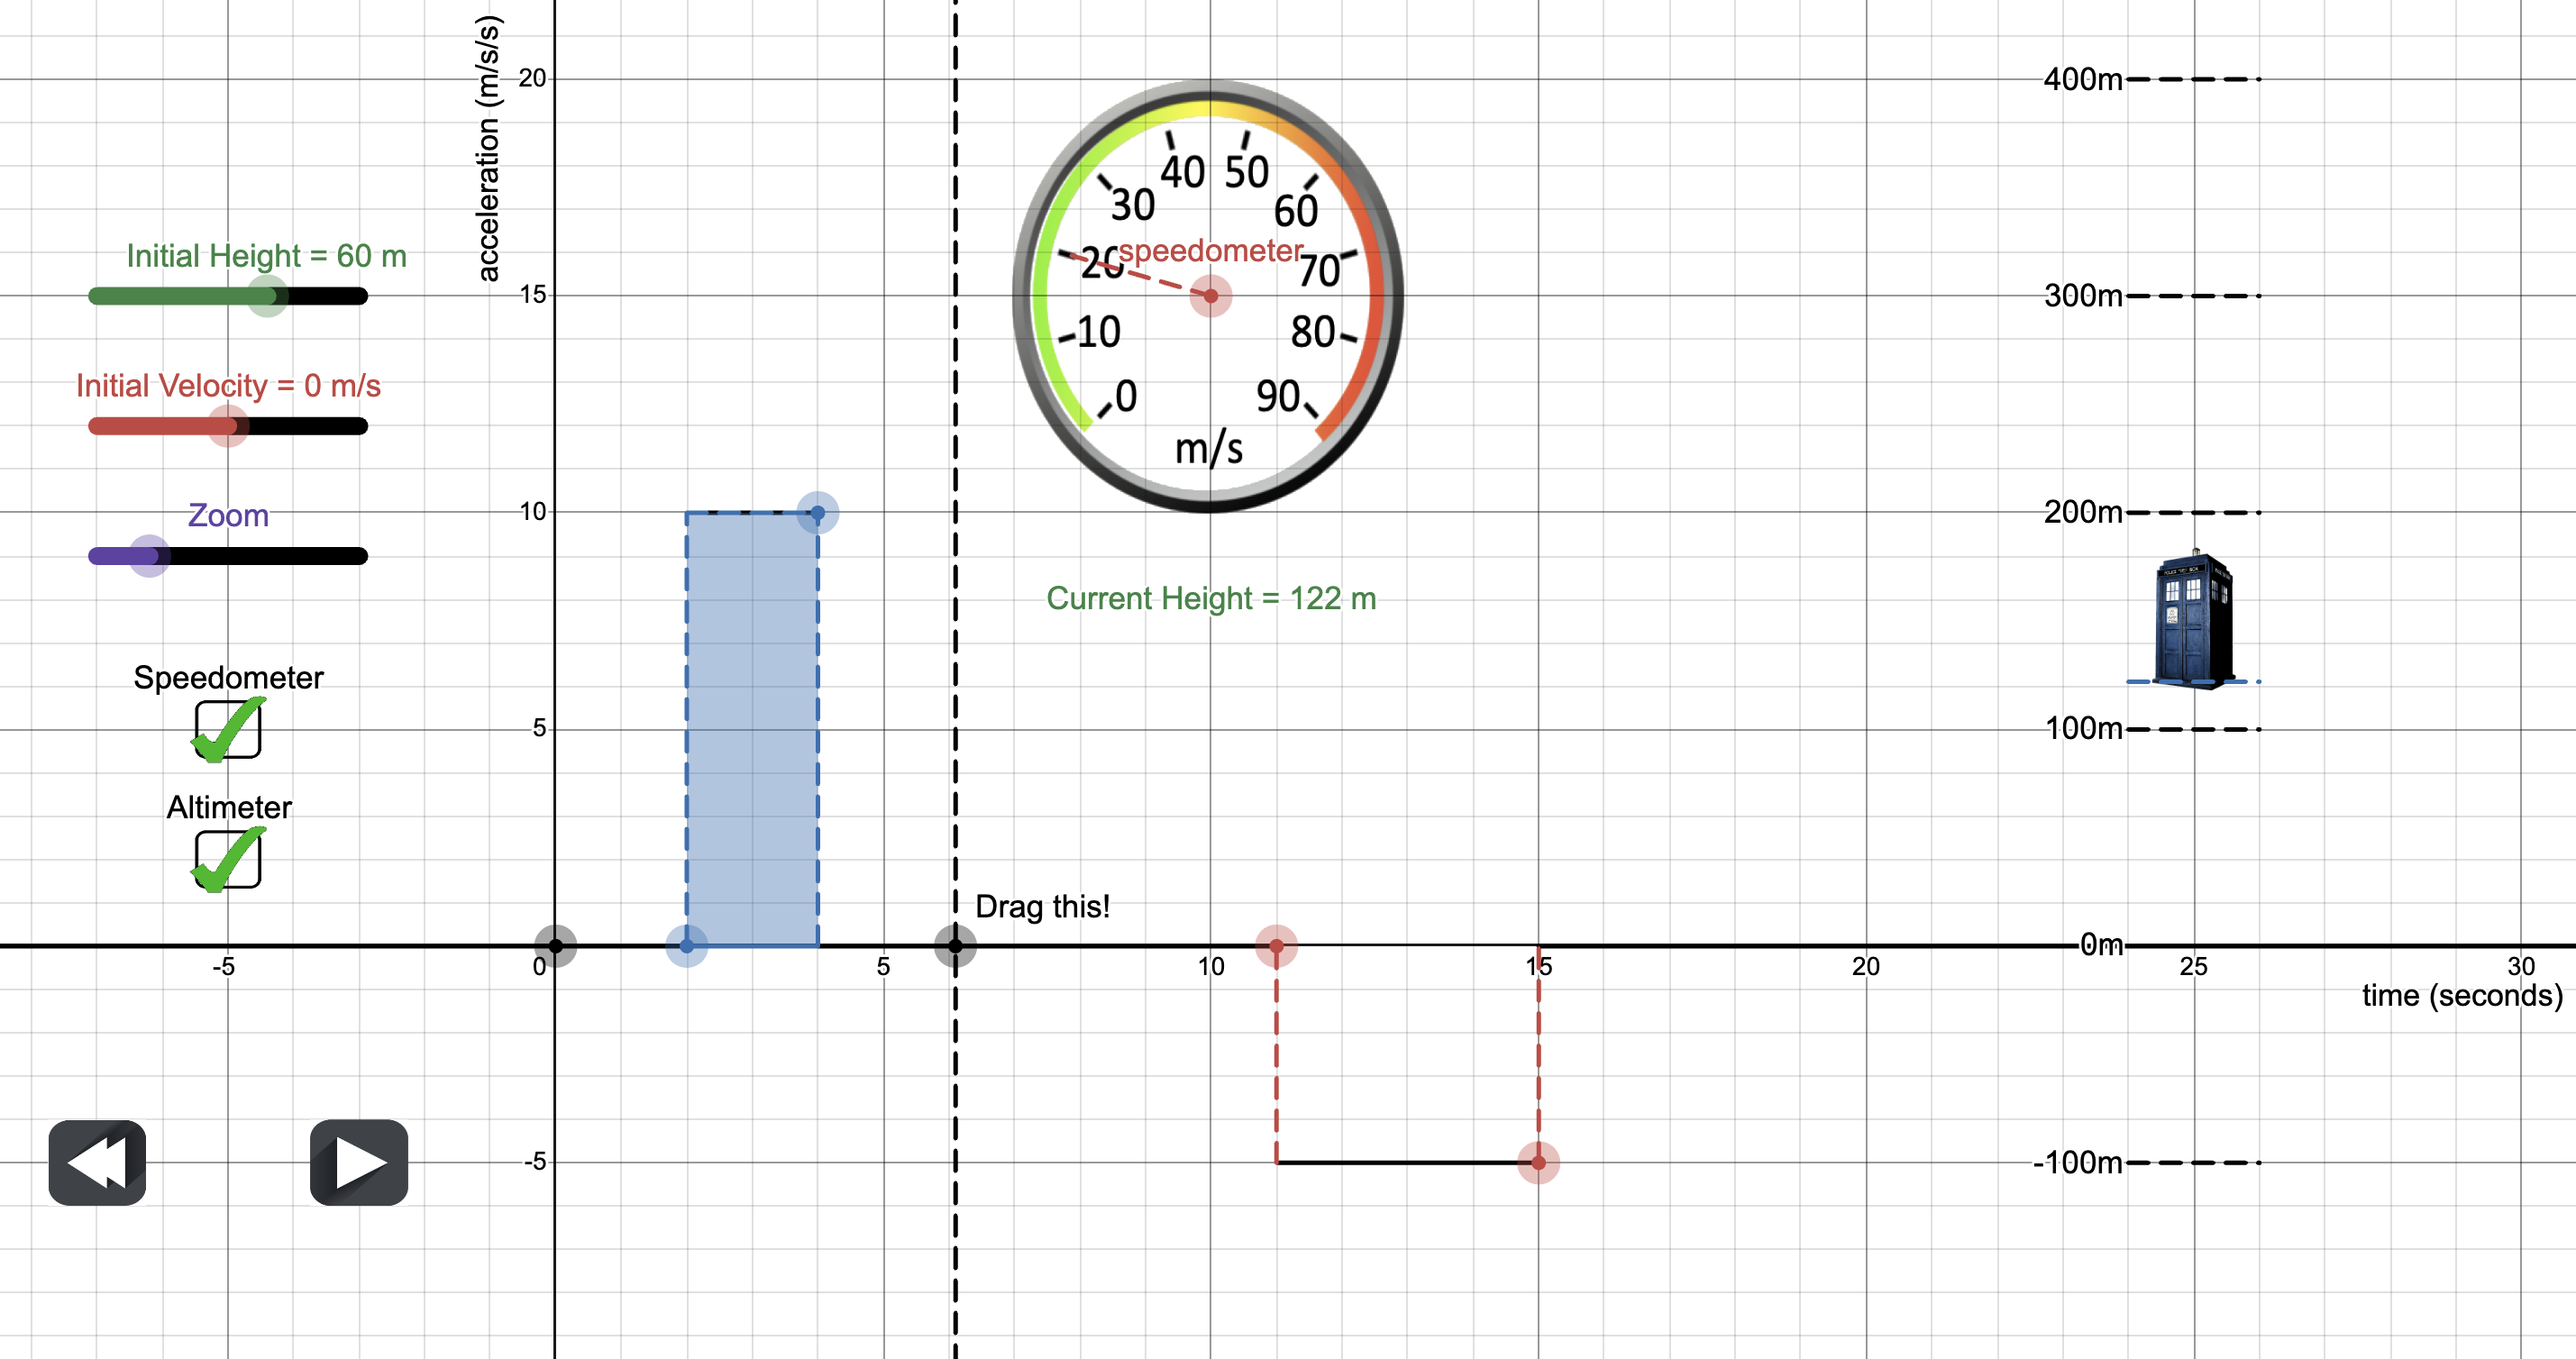
Acceleration-Time Graph
Learn how acceleration vs. time graphs connect to velocity and position.
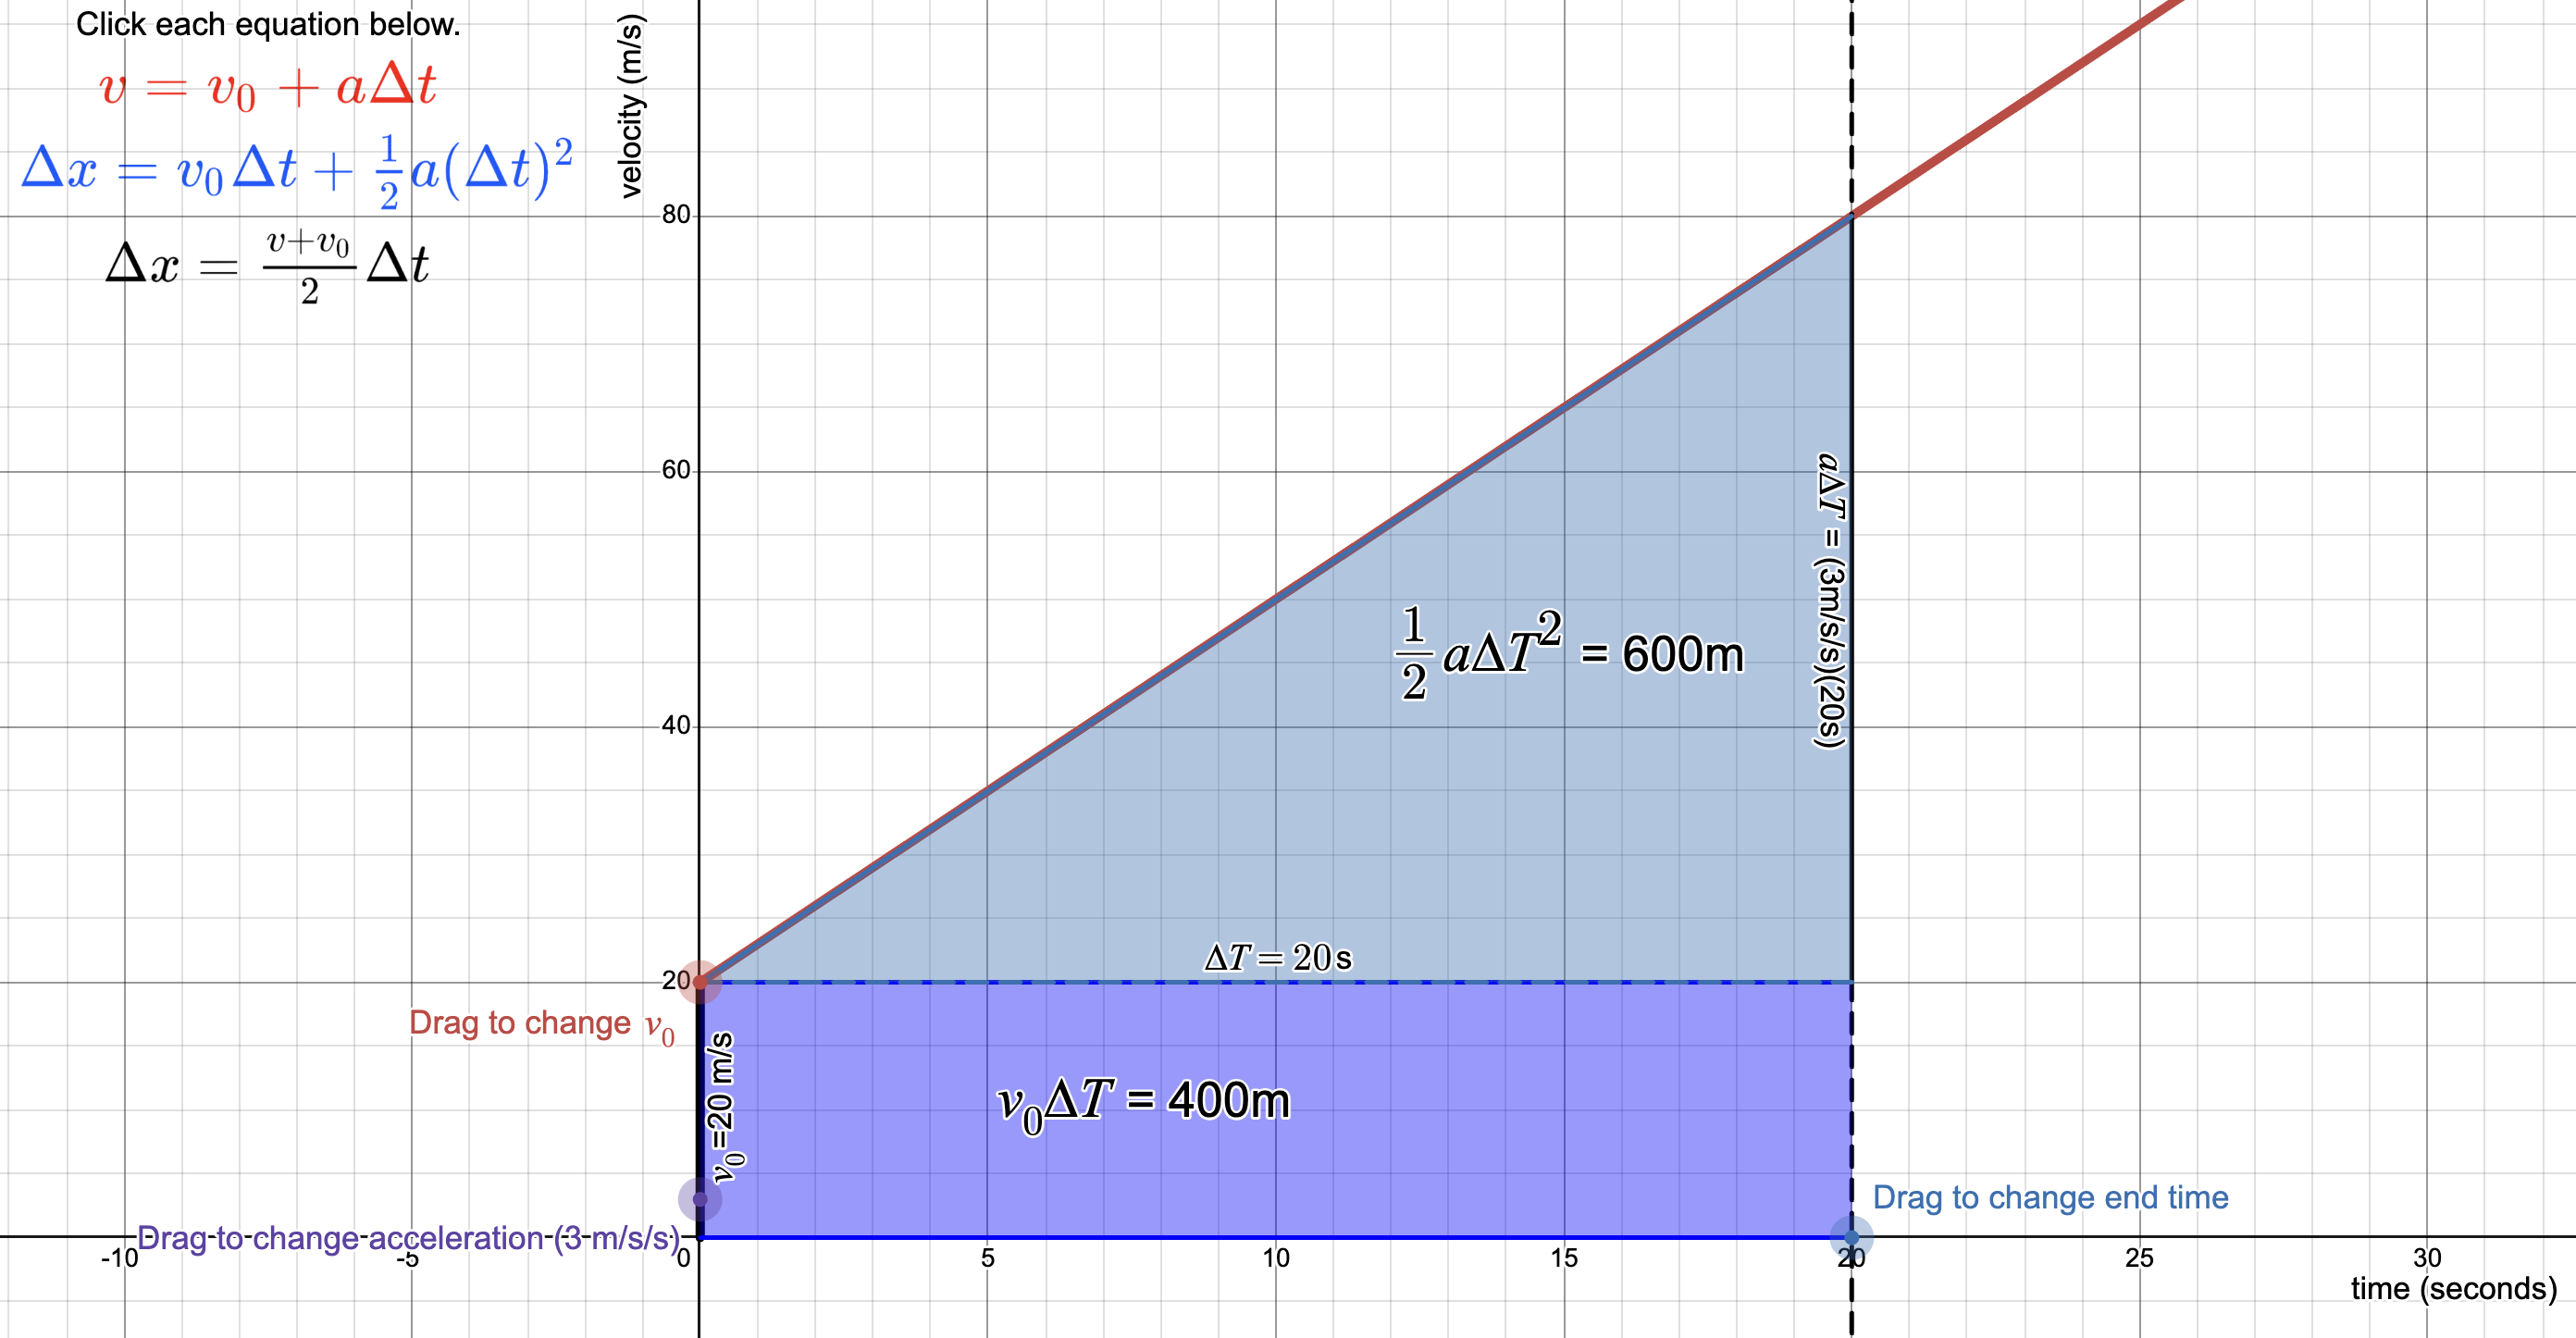
Visualizing Kinematics Equations
Explore how the kinematic equations can be visualized on a velocity vs. time graph.
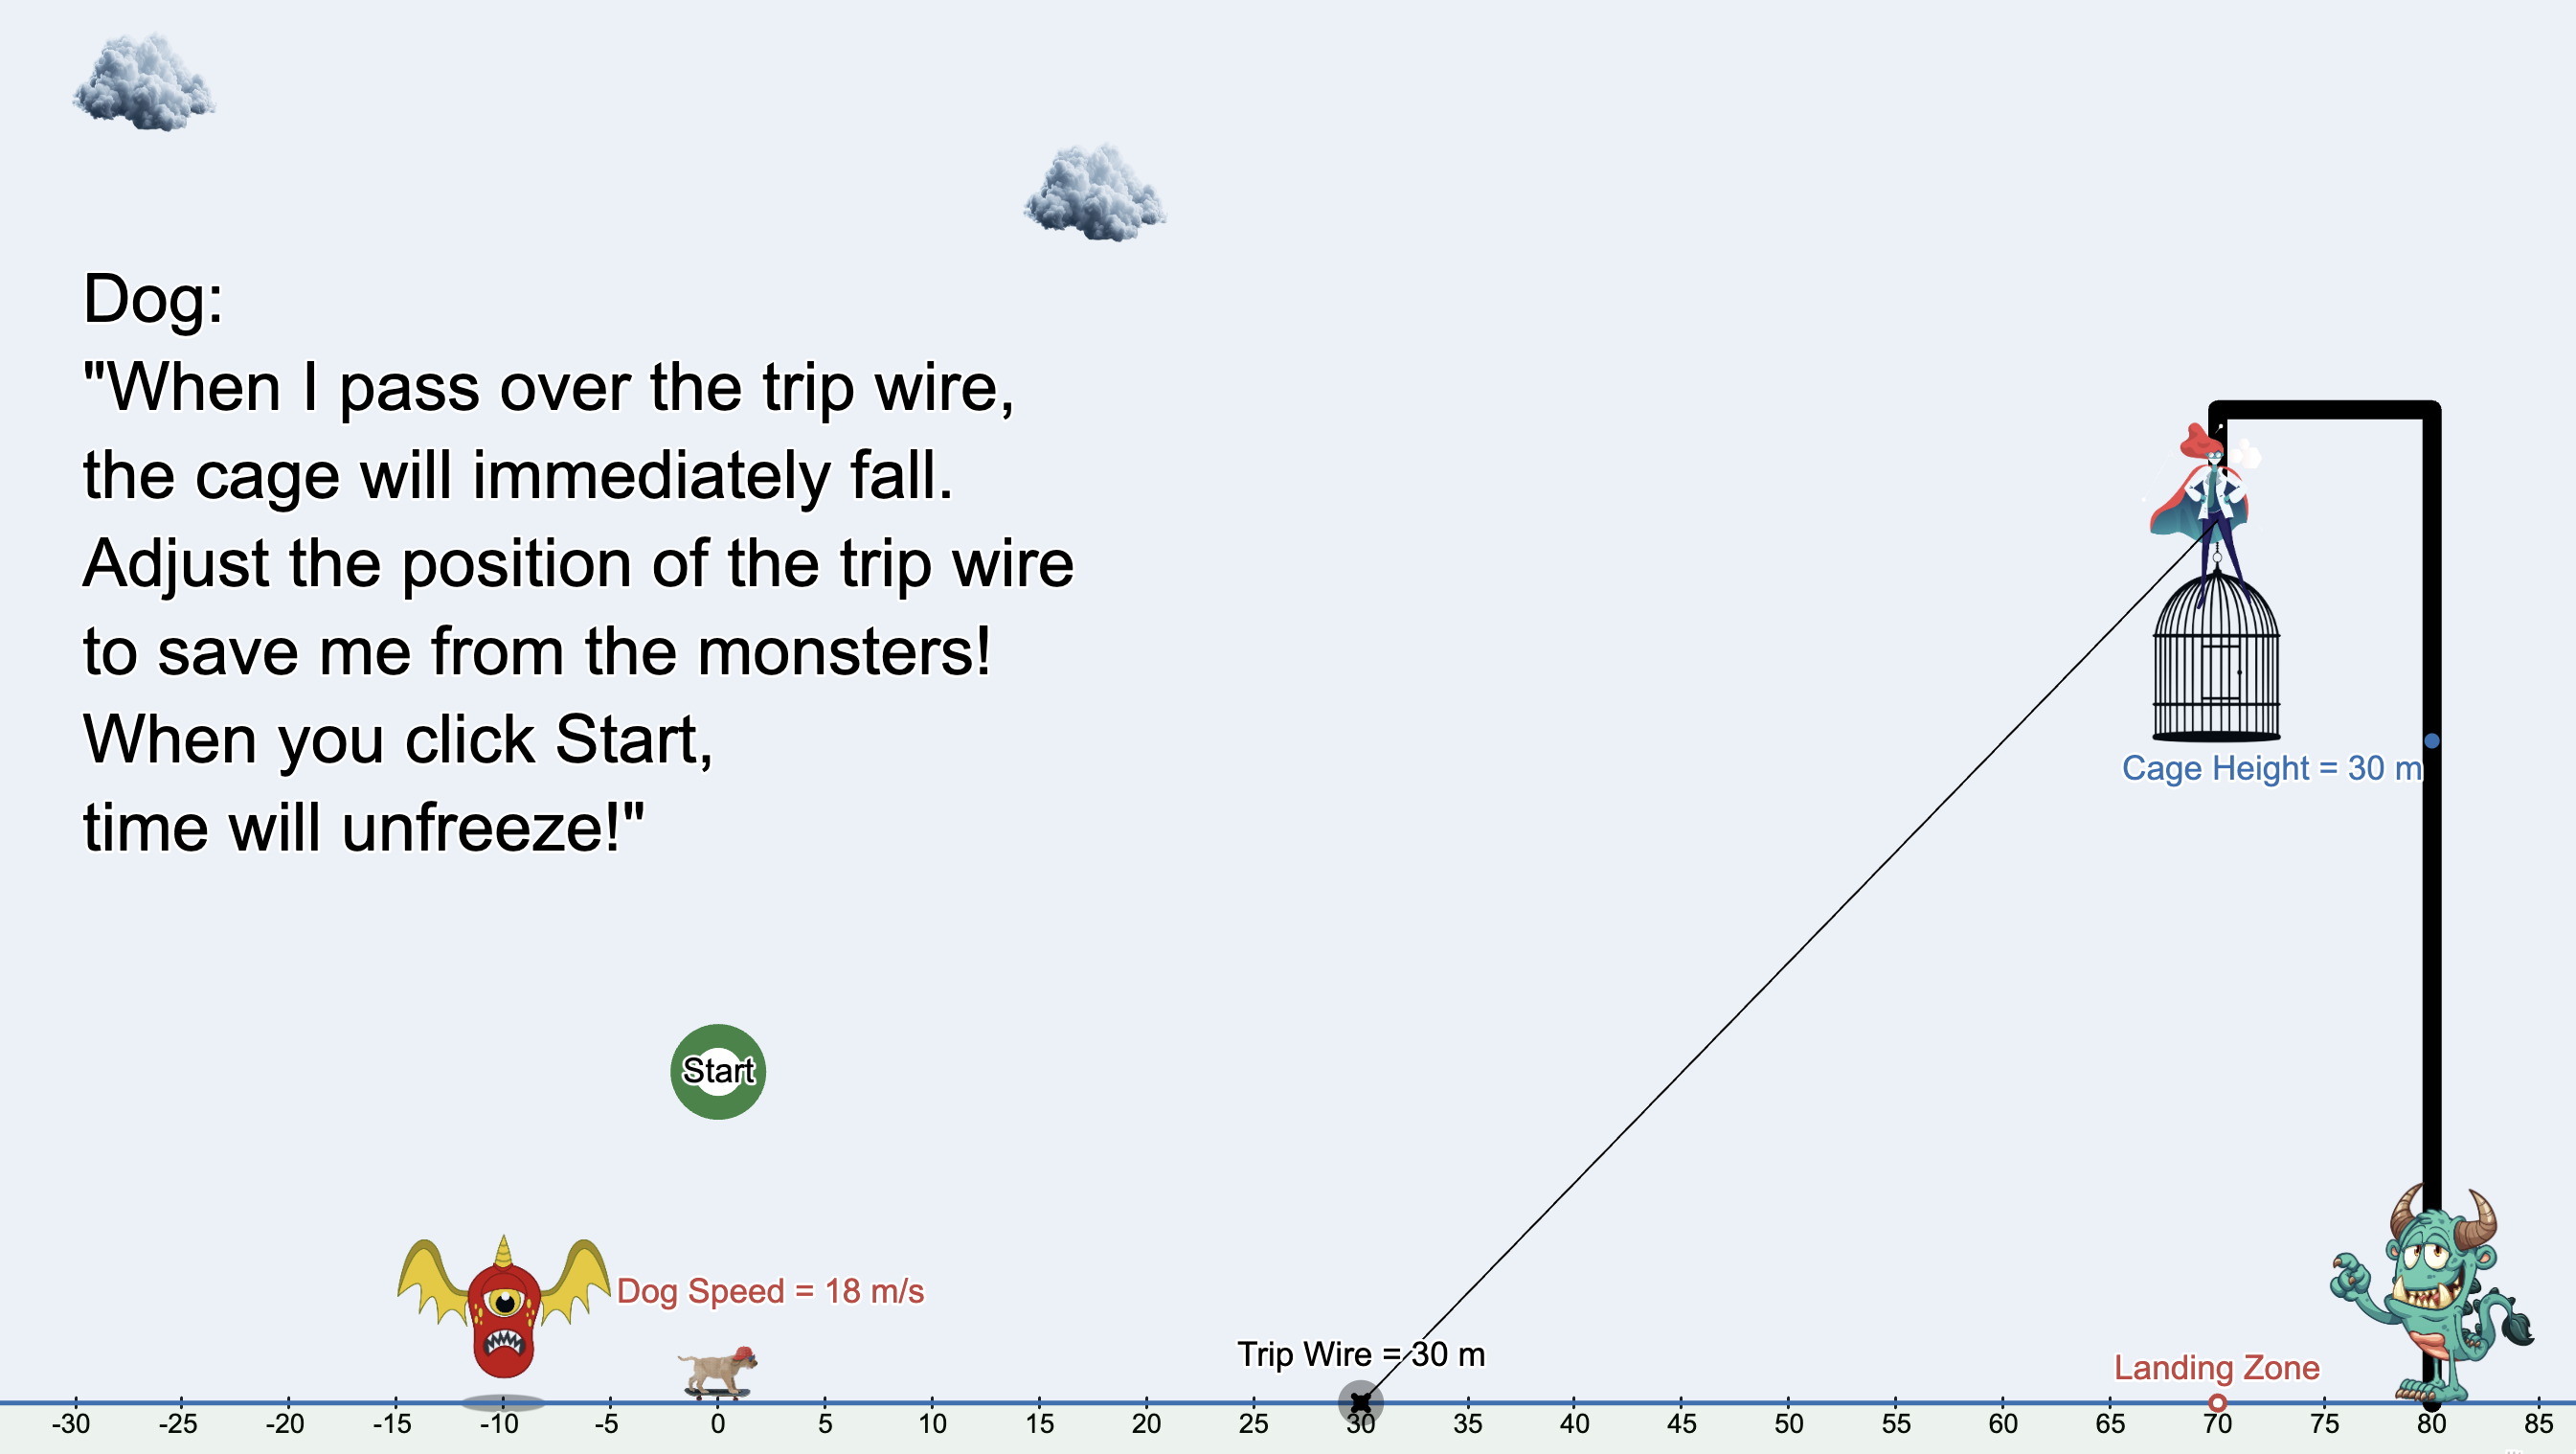
Save the Dog
Challenge your understanding of motion by rescuing a pup using physics!
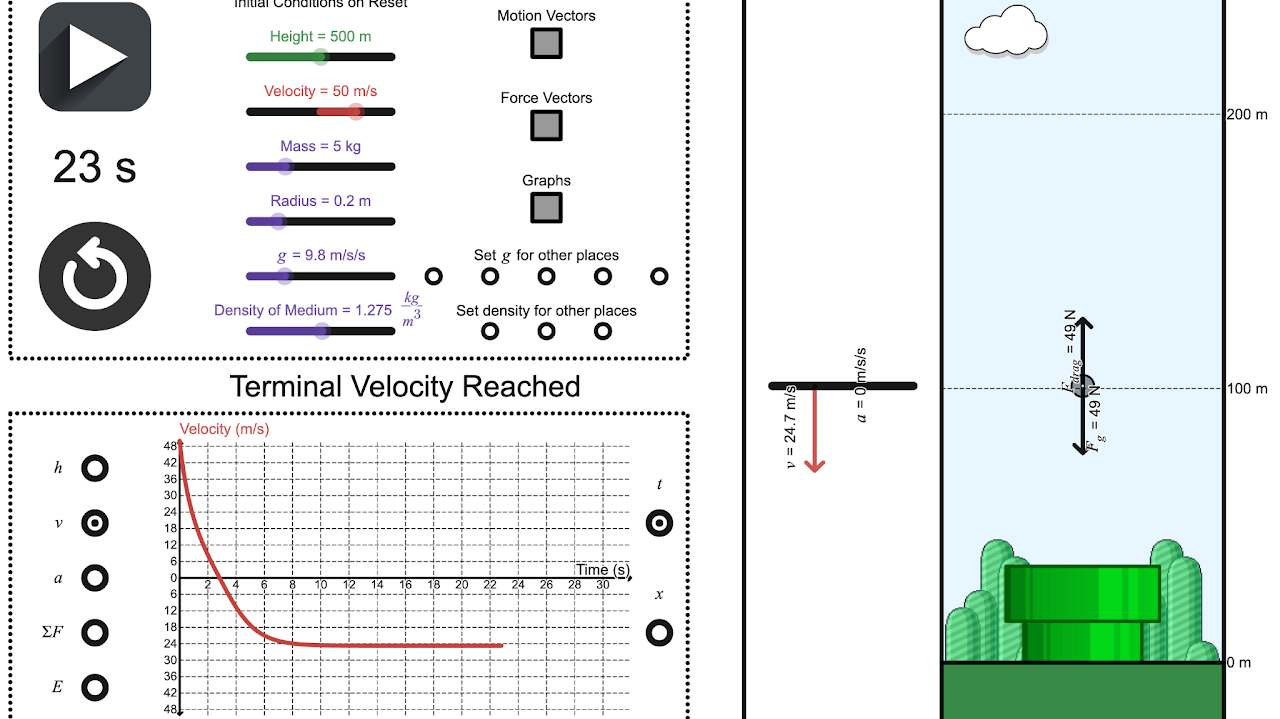
Falling Through Air
Analyze the effects of air resistance on falling objects.
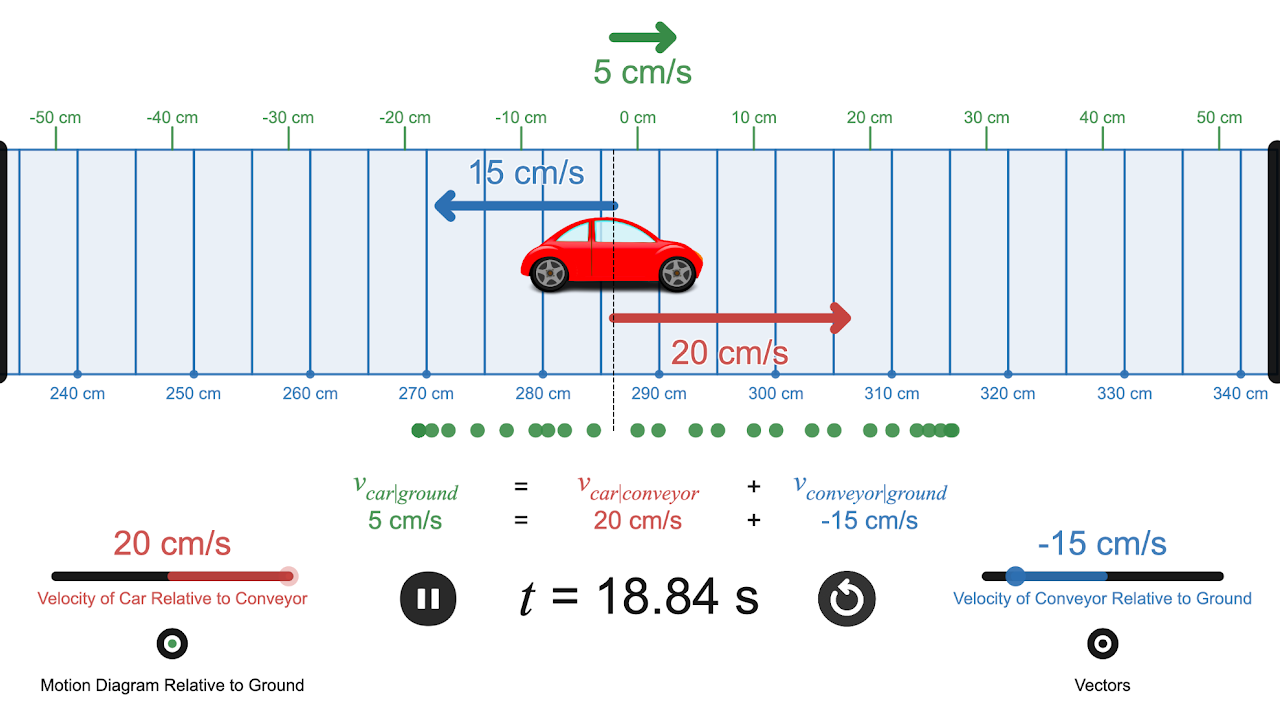
Car on a Conveyor 1D
Explore relative motion on a moving platform in one dimension.
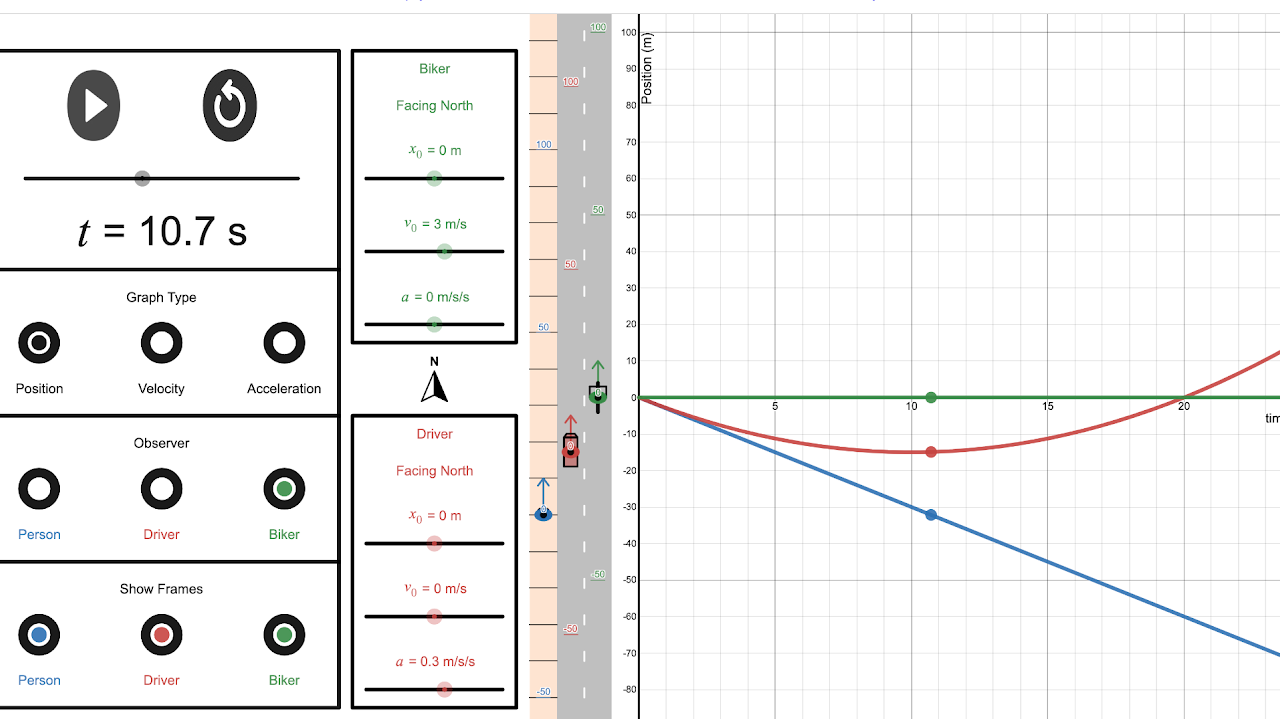
Reference Frames (Graphs)
Switch between reference frames and see how graphs of motion change.
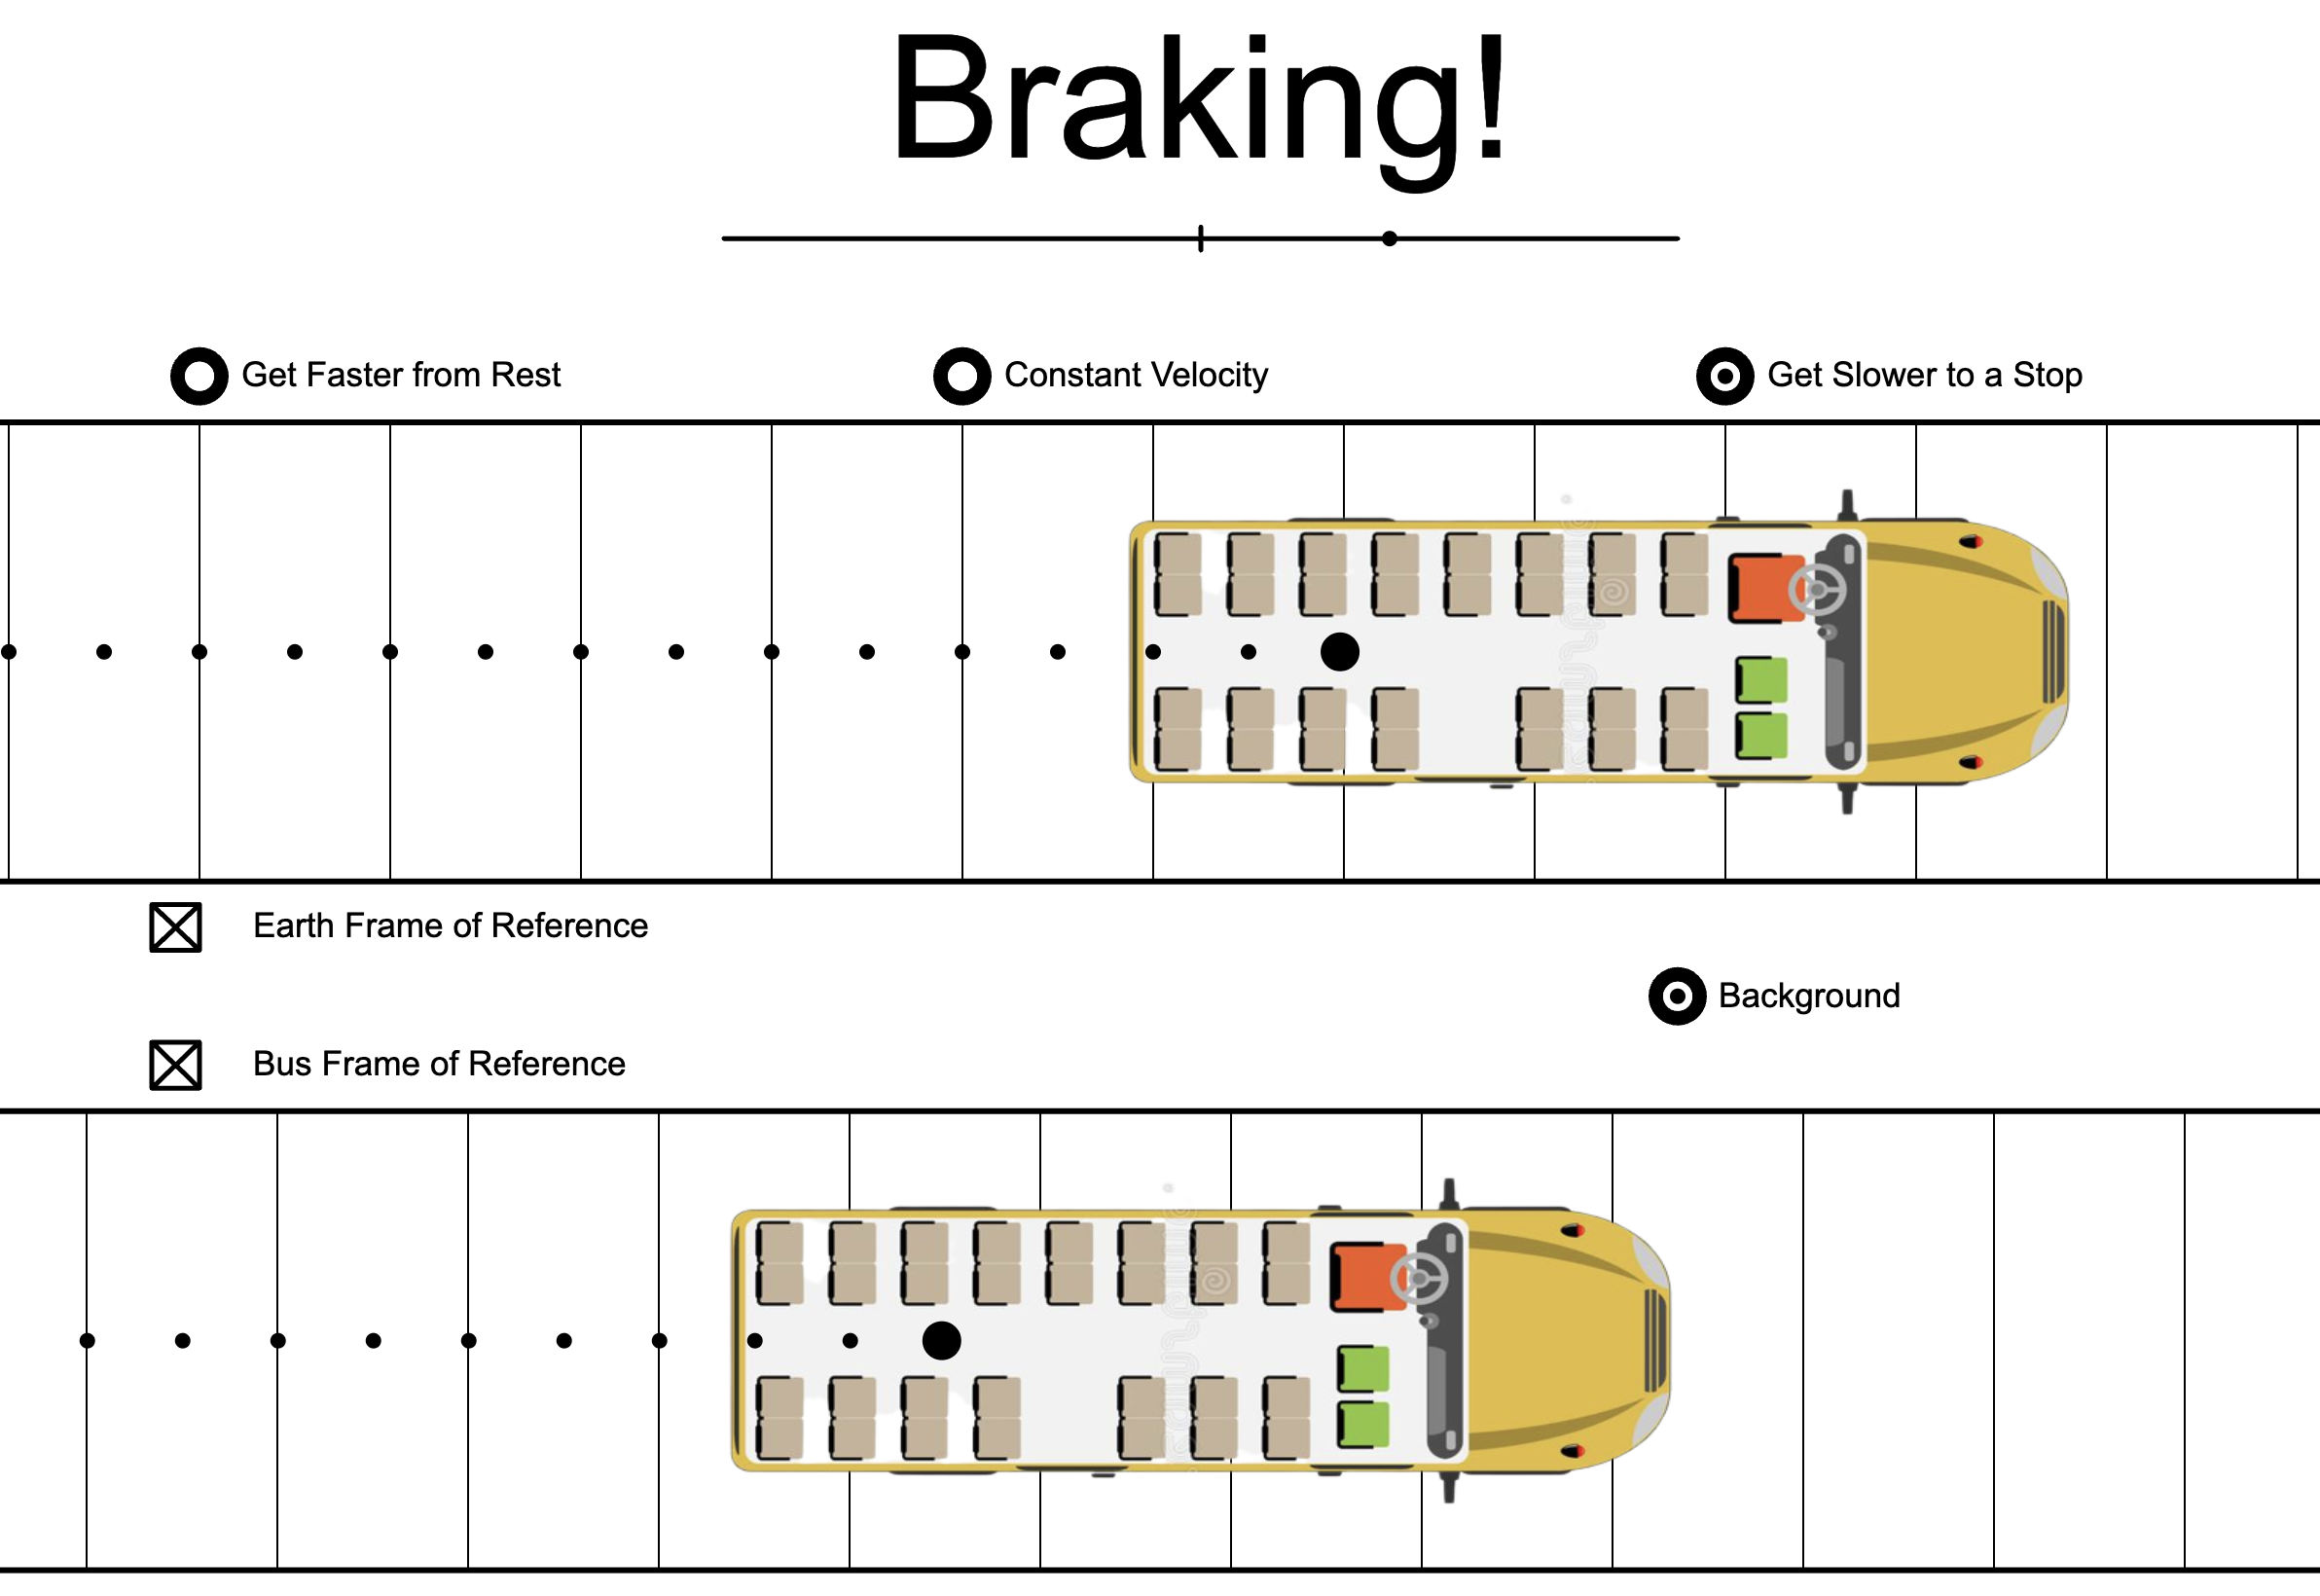
Reference Frames (Inertial vs. Non-inertial)
Understand how different observers measure constant velocity motion in inertial and non-inertial reference frames.